D&D.Sci, problem 1 (solution)
This post is part of my "dnd.sci" series.
These are my thoughts after seeing the solution to D&D.Sci, problem 1. For my independent work, see here. See also part two.
Note: I made a dumb mistake last part, and got our adventurer's stats wrong. Our 14 DEX should be a 13, and our 13 CON should be a 14. I have corrected that mistake for this part.
Back in part one, I made the following predictions (main predictions bolded):
- The best way to spend our points is to push our STR and CHA to 8, then max out WIS. Our final stat distribution is STR 8, DEX 14, CON 13, INT 13, WIS 16, CHA 8.
- Our chance of success is about 53%.
- Total ability scores are generated first, then distributed among individual scores.
- Ability modifiers don't matter, scores matter.
- DEX has a very small negative effect on chance of success.
- Improving extreme scores (high or low) matters much more than improving scores near the middle.
- There is some sort of easy test for INT, such that it provides diminishing returns after 8 points or so.
- Pushing CON, WIS, and CHA is good all the time. Pushing INT and STR is only good near extreme values.
Let's see how I did first, and then take a look at everybody else.
Will our hero survive?
I fired up the web interactive and input our hero's point distribution. My heart raced a little as my cursor hovered over the "Begin Quest!" button. I had done all that I could, it was time.
You succeed in your Great Quest!
OH THANK GOODNESS
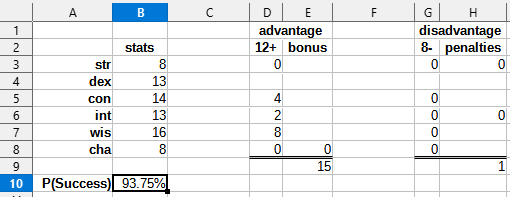
(you had a 93.75% chance of success.)
Whoa, what? That's not ~1:1 odds, that's more like 15:1 in our favor. It is error "in our favor". But error is error, and I missed a lot of stuff.
Like a grindstone dashed against an egg
How come we did so well? Let's look at the process that generated the data:
- Adventurer scores are generated by rolling 2d10; adventurers with less than 60 total points are not admitted into Adventurer College.
- An adventurer's chance of success is calculated from two intermediate scores (Advantage and Disadvantage) as follows: \(P(\text{Success}) = \frac{\text{Advantage}}{\text{Advantage} + \text{Disadvantage}}\)
- Advantage and disadvantage start at 1
- For every score above 12, add \(2 \times (\text{score} - 12)\) advantage.
- For every score below 8, add \(3 \times (8 - \text{score})\) disadvantage.
- If your STR is greater than your CON, add 2 disadvantage.
- If your INT is greater than your WIS, add 2 disadvantage.
- If your CHA is greater than 16, add 5 advantage.
From this we can make a simple spreadsheet to calculate chance of success from a given set of stats:
How did my predictions do?
- (CORRECT) I spent the available points points optimally, archieving the maximum chance of success given the constraints.1
- (WRONG) I got chance of success super wrong.
- (WRONG) I was wrong about scores being generated first and then distributed, I didn't even consider Adventurer College having an entrance exam.
- (CORRECT) Ability modifiers don't matter.
- (WRONG) DEX has no direct effect on chance of success.
- (CORRECT) Middling scores literally don't matter.
- (WRONG) There is no "easy test for INT". INT looked less appealing above 8 points because increasing INT risks pushing it above WIS, triggering a penalty.
- (WRONG) INT and STR are just as valuable as CON, WIS, and CHA. They just seemed bad because of the penalties.
Three out of eight. You could argue that 5, 7, and 8 could get partial score, but even then it isn't stellar.
How high can we go?
Now that we have a provably optimal predictor, we can check just how high R-squared could theoretically go. I already calculated chance of sucess from stats, so I'm using the Multiple Operations tool (in a bit of a hacky way) to run the calculations over every row.
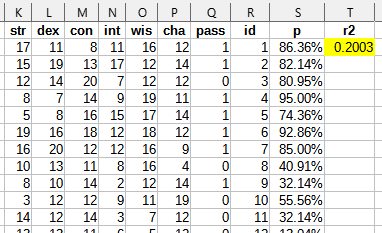
0.2003, surprisingly low. This makes me feel a lot better about the 0.1576 I got from segmented regression.
Retrospective
Learning from experience
Looking back, what could I have done better?
- Plotting a histogram for the sum of stats would have made the 60 point cutoff painfully obvious. Plot more stuff in general.
- None of the things I did could have caugth interactions between stats. I need to shop around for some method that can catch those.
- Same for cutoff points.
- I can detect some non-linear relationships with polynomial regression, my segmented regression hack, logistic regression, etc, but I have no clear path to detecting non-additive relationships.
Learning from others
Looking at other people's work, here are some contributions that caught my eye:
Straightforwardness
- Asgård assumed independent effects from each stat and calculated the success rate at each score. This is simple and leverages the abundance of data at our disposal. Asgård got an optimal stat distribution.
- GuySrinivasan looked at the 2-20 range on all stats and went "huh, I wonder if this is a 2d10". And then figured out that P(12d10 > 60) = 74%, which tracks with generating 10,000 adventurers and keeping the ones over 60 total score. Richard Feynman was right, there is no substitute for knowing numbers. Despite absolutely nailing the generation algorithm, GuySrinivasan ended up with only 64% chance to succeed.
- Ericf did basically the same as me, but with less regression and more graphs. Honestly, his approach may be better. The redeeming trait of regression is being able to control for confounders.
Matching
- Charlie Steiner and CptDrMoreno looked for "siamese" adventurers to check whether results have some random component.
- ADifferentAnnonymous estimated success chances for a specific score distribution by averaging "close enough" builds. This gets around the curse of dimensionality2. This is the core idea behind k-NN methods.
Advanced tools
- Samuel Clamons' analysis showcases the kind of tool I want to use for problem 2 and onwards, but he went way overboard and I can't read some of his graphics. Despite having really slick tools, Samuel ended up with only 81% chance to succeed.
- Several people threw neural networks at the problem. The results were all over the place. Even when they performed well, they yielded few insights. I'm not sure this is an approach I can leverage.
- lalaithion took an assortment of tools from scikit-learn and threw them at the problem. He got four proposals, but no insights into how the problem works. Two out of four proposals got close to optimal.
Learning from perspective
It's been less than two weeks and I already hate the first post in this series. It's way too long and rambly. The whole hypotheses section could have been cut. I point to very few sources (because I am mostly winging it from half-remembered college classes). And I desperately need to work faster.
-
There was some leeway here, this was one of a few different optimal configurations. ↩
-
We have a lot of adventurer records but there are so many possible ways to spend our points that most concrete builds end up having few or no adventurers in them. In general, the more variables we have, the "density" of the data decays exponentially. ↩