D&D.Sci, problem 1
This post is part of my "dnd.sci" series.
This is my independent work on D&D.Sci, problem 1. For my thoughts after seeing the solution, see here.
Note: I made a dumb mistake and got our adventurer's stats wrong. Our 14 DEX should be a 13, and our 13 CON should be a 14. Thankfully, it does not end up mattering to the analysis.
I finally found the time to get into a project I've been wanting to do for a while: getting comfortable with statistics and data analysis. I took intro statistics and data analysis in college, but the classes were superficial and unfocused, and by now I've forgotten most of what they did cover. I can rant at length about formal education.
Since the project has been in my mind for a while now, I've kept an eye out for a problem set to work on. I could download some Kaggle datasets, but if I used real-world data I'd have no way to check I've gotten results that make sense. Fortunately I stumbled upon D&D.Sci, a collection of statistics/inference/data analysis challenges with sythetic data, loosely inspired by Dungeons and Dragons' setting and mechanics. It looks fun, it's not paywalled, and there are known correct solutions.
College did thankfully give me some background in Python Pandas and Spark, plus I did some data processing on Awk because it is pure joy to use a tool that fast. I also know how to tinker with a spreadsheet to an amateurish level.
However. Since I have a terrible track record for actually sticking to projects, I'm limiting my scope for the first problem: everything must be done on a spreadsheet with builtins only. Hopefully this will curb my perfectionist impulses.
I'm arriving super late to this, so the competition already over. I'm consequently not going to rush the analysis. I am going to avoid spoiling the answer for myself. I'll finish my writeup of the analysis and then look up how the data was generated and how well I did. If I end up looking like a dumbass, then so be it.
Problem statement
I cannot do the original justice without copying it in its entirety: go read it instead.
tl;dr. You are an Adventurer, taking on a Great Quest. Your stats are:
- Strength (STR): 6
- Dexterity (DEX): 14
- Constitution (CON): 13
- Intelligence (INT): 13
- Wisdom (WIS): 12
- Charisma (CHA): 4
You get to increase your attributes by 10 points. Distribute them to maximize your chances of succeeding in your quest. No attribute may exceed 20 points. To figure out how your attributes affect your chances, you have access to the records of over 7000 attempted Great Quests.
Control questions
- How are stats generated?
- Are stats independently generated? Look out for correlations/anticorrelations between stats.
- Where do we fit in the distribution?
- What is the base rate of success?
- Assumption check: no attribute is negatively correlated with success
- Are attribute modifiers the only thing that matters?
Hypotheses (before looking at the data)
There are infinitely many possible ways to go from a stat block to a probability of success. To illustrate the point, keep in mind that one such function is
\[P(success|X) = \begin{cases} 1 & \text{if } X = (6, 9, 4, 20, 6, 9) \\ 0.5 & \text{otherwise} \end{cases}\]Needless to say, we don't have nearly enough data to pluck out the correct function out of thin air. We must narrow the scope of our work to a small number of simple hypotheses.
Max stat
This could happen if the Great Quest reduces down to a straight ability check, and we get to choose which ability we use for the check. Since we'll obviously pick our best stat, the others don't matter.
No stat contributes specially to success. Being about average is terrible compared to being specialized. Max stat is the best predictor for success.
Under this regime we expect all stats to correlate to success, and for that correlation to go away when controlled for max stat.
Sum of stats
This could happen if the Great Quest reduces down to a straight ability check, and we don't get to choose which ability we use for the check.
No stat contributes specially to success. Being about average is just as good as being specialized. Sum of stats is the best predictor of success.
Under this regime we expect all stats to correlate to success, and for that correlation not to go away no matter what we control for.
Weighted sum
This is the standard statistics approach. Each independent variable is assumed to have independent influence over the dependent variable.
This could happen if the Great Quest reduces down to checks on all abilities, but the checks are not of the same difficulty.
Some stats contribute more to success than others. Being about average is worse than being correctly specialized, but better than being incorrectly specialized. Best predictor?
Under this regime we expect all stats to correlate to success, and for that correlation not to go away no matter what we control for.
Min stat
This could happen if the Great Quest reduces to checks on all abilities, or a single check on our worst stat. Since failing any check is a disaster, sucking at any one thing means failing the quest.
No stat contributes specially to success. Being about average is better than being specialized. Min stat is the best predictor of success.
Under this regime we expect all stats to correlate to success, and for that correlation to be lessened (but not eliminated) when controlled for min stat.
Analysis
How are stats distributed?
We can get a decent summary of the data with the PERCENTILE() function, and a sense of where we are with PERCENTRANK().
| . | str | dex | con | int | wis | cha |
|---|---|---|---|---|---|---|
| min | 2 | 2 | 2 | 2 | 2 | 2 |
| 5% | 5 | 5 | 5 | 5 | 5 | 5 |
| 25% | 9 | 9 | 9 | 9 | 9 | 9 |
| 50% | 12 | 12 | 12 | 12 | 12 | 12 |
| 75% | 15 | 15 | 15 | 15 | 15 | 15 |
| 95% | 18 | 18 | 18 | 18 | 18 | 18 |
| max | 20 | 20 | 20 | 20 | 20 | 20 |
| our rank | 6.38% | 65.60% | 56.70% | 58.10% | 48.70% | 1.60% |
Attribute correlations
Looking at the correlation matrix:
- Every attribute is anticorrelated with every other, suggesting that there is a tradeoff between them.
- All attributes are positively correlated with success, except for DEX which is anticorrelated.

Let's address point 2 first, because it is weird. What do you mean seeing more DEX implies lower chances of success? Maybe having a high DEX does not hurt directly. Instead DEX may just be a waste of precious attribute points, as seen in point 1.
Point 1 is more or less what we expected. Most likely each Adventurer is born into the world with a given amount of points that are then distributed among their stats. So seeing a high DEX gives us confidence they have a high total number of points, but lowers our confidence they have high anything else.
How big a deal are these? A Pivot table shows us the means of every attribute in the general population, as well as segregated by success or failure. We can then plot this information to get a feel of how the typical successful adventurer looks like, versus failed adventurers, versus the population norm.
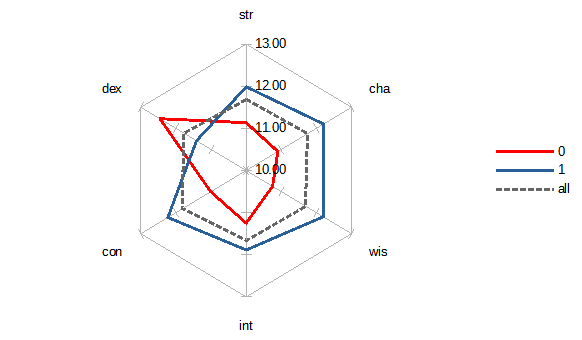
Those look like a lot.
Modifiers
If the Great Quest works by Dungeons and Dragons rules, our ability scores don't actually matter. What matters is our ability modifiers, which are calculated as \(\lfloor \frac{\text{ability} - 10}{2} \rfloor\). We'd then expect to see no difference between 12 STR and 13 STR: they both end up as a +1 modifier. In general, all odd scores waste an attribute point.
| Attribute | Modifier |
|---|---|
| … | … |
| 9 | -1 |
| 10 | 0 |
| 11 | 0 |
| 12 | +1 |
| 13 | +1 |
| 14 | +2 |
| … | … |
We can check if this is the case by adding up all the useful ability points and all the wasted ability points separately and checking that the wasted points don't have any predictive power over the chance of passing.

Well that's that for that hypothesis. It seems this problem does not work like D&D.
The role of DEX
Is DEX actually harmful, or just a dump of precious points? I'm currently digesting Judea Pearl's "Book of why"1. I've got a fragmentary understanding of it at best, plus I think the book isn't meant to be usable without having read "Causality"2, but I'll be borrowing the notation and concepts anyway.
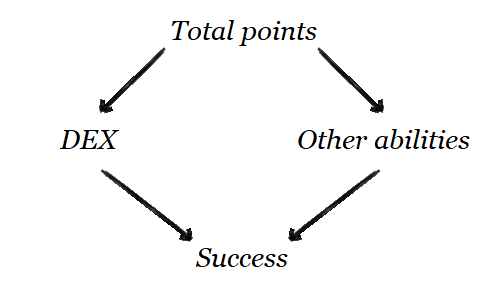
We are interested in the direct effect of DEX on Success. Pearl says that we have to block all non-causal paths from DEX to Success; so the one that goes through "Total points" and "Other abilities". The problem is that he doesn't spell out how to perform "control".
I am out of patience. I'm not going through another book for this, so I'm going to go with the guess that he means adding "predictor" (DEX) and "control" variables (one of "Total points" or "Other abilities") to our regression model.
Running a linear regression on DEX, Other abilities -> Success3 (R-squared = 0.1356) we get a very tiny but still non-zero coefficient on DEX. Is this term significant at all? Linear regression seems to think so, the 95% confidence range on the coefficient does not include 0.
It seems high DEX actually harms our chances. Not so much that we would care to spend points lowering our score (and it isn't an option anyway) but still, this is a very weird conclusion.
Other stats
Running a linear regression on every stat other than DEX at once (R-squared = 0.1403) tells us that all stats are valuable, but not equally valuable.
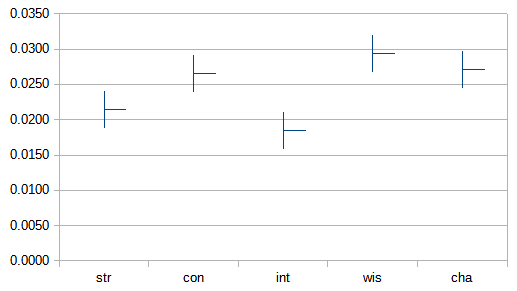
WIS, CHA, and CON are neck and neck. STR and INT trail behind.
Specialization
Running a linear regression on every stat other than DEX, sorted from highest to lowest (R-squared = 0.1535) tells us that our worst stat matters a lot, with our best stat mattering not-quite-so-much (about 70% as much).
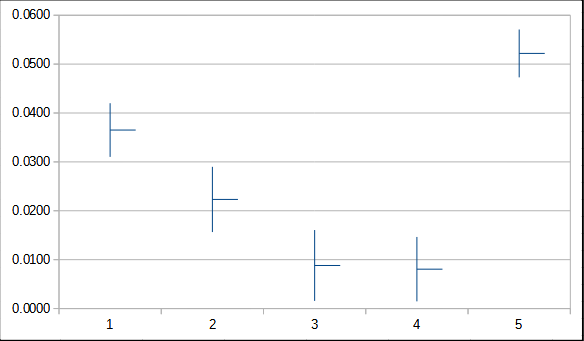
This is what I expect from a world that rewards "specialized but" profiles. Specializing is good, but you want to spread out the costs of specialization instead of dumping one stat. Except DEX. But we can't dump DEX, we start with 14 points there.
Since extreme values seem to be important, I tried regressions on the geometric and harmonic means of stats (sans DEX), but they did little better than a simple sum of stats.
The role of INT
INT has a low correlation with success, which is weird. This would happen if there was a test for INT, but that test was either unusually easy or unusually hard. If it was easy you'd see INT causing success for dumb people, but not for smart people, and viceversa. So I split the dataset by INT below and above 10 and got a massive correlation jump on the low intelligence group.
| group | INT coefficient | R-squared |
|---|---|---|
| low int | 0.0529 | 0.1592 |
| high int | 0.0160 | 0.1384 |
This tells us:
- don't dump INT, which we already knew from the specialization analysis
- and don't specialize on INT, which we already knew from looking at stat correlations.
There remains the matter of how to interpret the R-squared of our split model.
R-squared is a measure of variance explained. It is calculated as4
\[R^2 = \frac{SS(mean) - SS(fit)}{SS(mean)}\]where SS(mean) is the sum of square differences around the sample mean and SS(fit) is the sum of squared differences around the prediction function.
\[SS(mean) = \sum _{\forall (x, y)} {(y - \bar y)^2}\] \[SS(fit) = \sum _{\forall (x, y)} {(y - f(x))^2}\]There is no indication that the prediction function should be linear, so we could simply calculate adventurer scores from the segregated data, pool together the scores and successes, and then calculate R-squared from there.

Segmented regression
Can we can efficiently check which stats show exceptional returns near extreme values? This would tell us which of our strengths to double down on, or alternatively, which weaknesses to address.
We can check each stat by hand like we did with INT, but that is a lot of work. What we want is a way to run segregated regressions on every stat, all at once.
I could, at this point, stop using a spreadsheet and move to Python, where I'd have ready access to library implementations of segmented regression, random trees, etc. But I did say I was going to do this with spreadsheet builtins only, so I'll have to hack a spreadsheet solution instead.
The straightforward way to do this would be to specify a full model made up of two lines and a cutoff point. We could then sort the data by the relevant attribute, split into above/below cutoff groups, and run linear regressions on each.
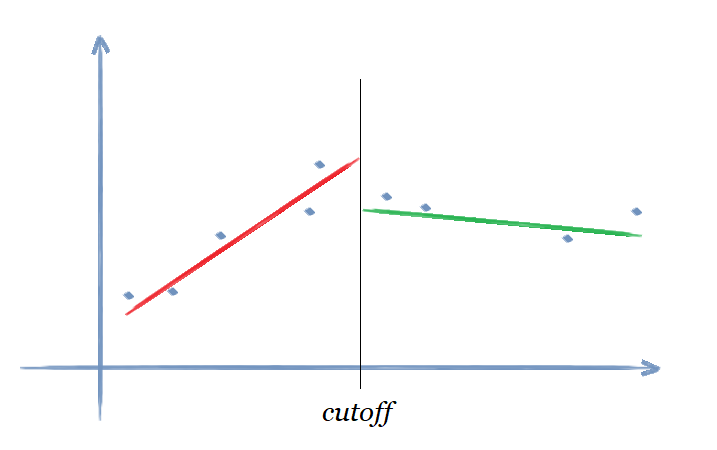
The problem with this is that we need to split the dataset for every dimension we are segregating. That means we would have take each adventurer and put it into one of \(2^6=64\) groups and then run a linear regression on each group.
…I'm not even going to try drawing that one.
That is both a lot of manual work, and more groups means less adventurers per group, which means less confidence in each indiviual regression.
Plus, if we want to avoid choosing the cutoff by hand, and instad make it part of the model, the model stops being linear. We are then left using a generic non-linear solver, which is insanely slow (I tried it, it wasn't pretty).
Instead I tried an approach inspired by polynomial regression. Polynomial regression is a kind of non-linear regression that can be performed with the same machinery which we use for linear regression. The reason why is out of scope for this article, but maybe I'll dig into Generalized Linear Models some other time.
For my segmented regression I took each stat, and split it into three variables: low stat, medium stat, and high stat, like so:
- low stat
=MIN(stat, 9) - medium stat
=MEDIAN(9, stat, 14) - 9 - high stat
=MAX(14, stat) - 14
We still have to manually pick cutoffs. I chose to split into first quartile (nines and under), middle two quartiles (tens to fourteens), and top quartile (fifteens and over).
This is like having three "containers" that we fill in order: first we try to fill low, then we take the rest and we fill medium, then we take the rest and fill high.
| Stat | low stat | medium stat | high stat |
|---|---|---|---|
| nines and under | stat | 0 | 0 |
| tens to fourteens | 9 | stat - 9 | 0 |
| fifteens and higher | 9 | 5 | stat - 14 |
Now each segment has it's own coefficient (read: slope) in the linear regression. If we take a look at what that means in 2D we can see that this generates a continuous line made out of straight segments.
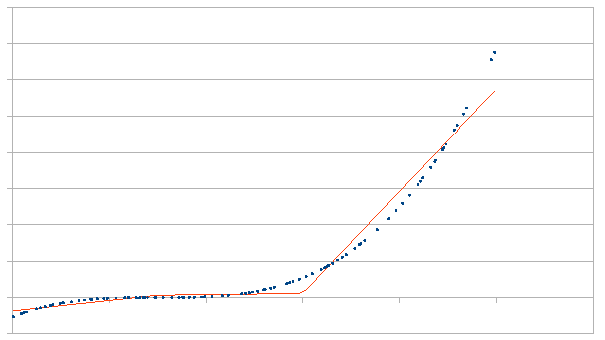
Note: image above is made from synthetic data unrelated to this problem. I am checking the tooling returns something sane.
Now we have something that works on high dimensions with minimal manual labor, and runs fast.
Let's take a look at our results. R-squared = 0.1576, best one yet. Below are the regression coefficients; the brackets where our character would fall in are highlighted in yellow:
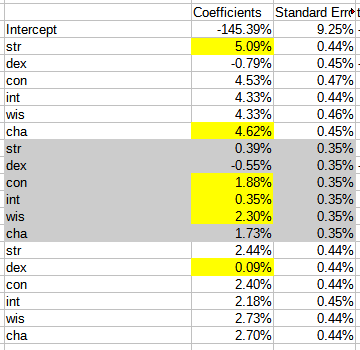
- DEX is still generally bad, except maybe near the top where it doesn't seem to actively hurt
- INT and STR are bad to drop, useless in the middle, and ok near the top
- CON, WIS, and CHA are good everywhere, with WIS looking like the best specialization
Optimizing stat distributions
With the coefficients we got from the previous analysis we have defined a formula that gives a measure of confidence in our success. It isn't a probability distribution, sadly, but it making it go up should make us more likely to succeed. I did look into generating an actual probability distribution, but logistic regression did not play nice with spreadsheets.
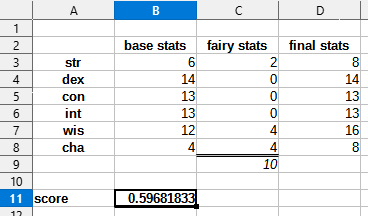
We can set up a sheet to calculate, for a given way of distributing our fairy points, what success score our formula assigns our resulting character.

Now we want to maximize our score by spending 10 points or less in the "fairy stats" column. I asked the solver tool to do this for me.
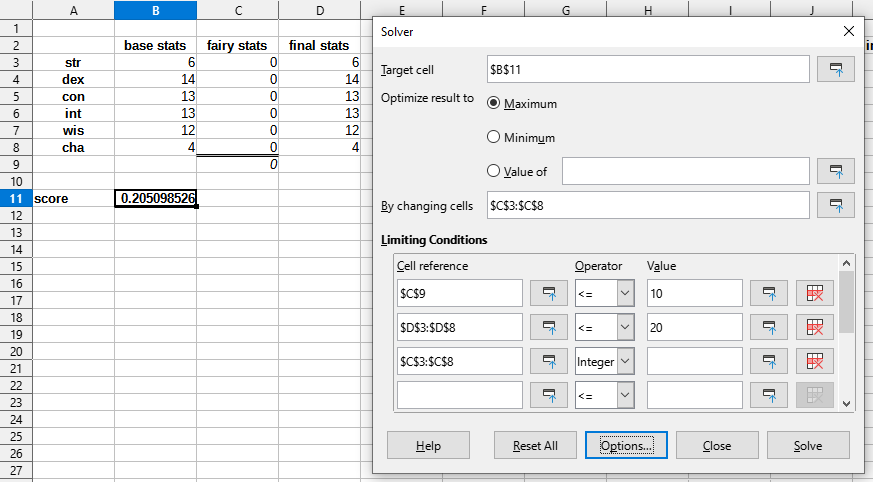
After about ten seconds, the solver came back to me with a proposal: push STR and CHA to 8, then push WIS with the rest of your points. Seems to check out so we'll go with that.
Forecasting success
How do our odds compare with the median adventurer after intervention? Once again, I didn't use logistic regression, so it's hard to say, but we can do a few things:
- Compare our final score to the median adventurer
- Study the distribution of scores to figure out where we are in relation to the rest
- Interpret our score as a probability, consequences be damned!
This is going to involve pulling numbers out of my ass, be forewarned.
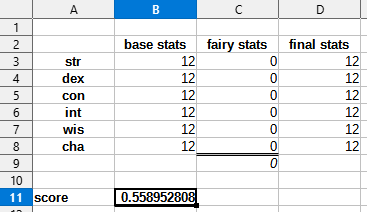
65.3% of adventurers succeed on their Great Quests. Our score is 59.7 versus a 55.9 of the "median" adventurer. We seem to be slightly ahead. I'd put our probability at maybe 70%?
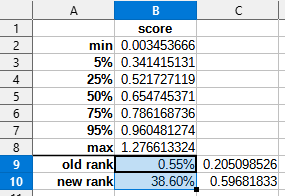
Ok what is going on here? We are ahead of an hypothetical adventurer with median stats, but we are behind the actual median adventurer! I don't know how to explain this, but I do know how to interpret it: data sampled from the actual distribution trumps fabricated examples any day. I now believe we are significantly behind, probability down to maybe 50%.
65.3% of adventurers succeed on their Great Quests. Our score, read as a probability (gasp! the scandal!) is 55.9%, up from 20.5%; underperforming the norm, but not dramatically, and not nearly as badly as we used to. Final probability at 53%.
-
Pearl, Judea, and Dana Mackenzie. The Book of Why: The New Science of Cause and Effect. First edition. New York: Basic Books, 2018. ISBN: 0141982411. ↩
-
Pearl, Judea. Causality: Models, Reasoning, and Inference. Cambridge, U.K. ; New York: Cambridge University Press, 2000. ISBN: 9780521895606. ↩
-
Why not
DEX, Total points -> Success? It shouldn't matter. But it does: I did run that regression, and we get a massive negative coefficient for DEX. What is going on? I scratched my head for a while before realizing what went wrong: my causal diagram had a missing arrow. My diagram implies that, if you know "Total points", then DEX should be independent from "Other abilities". But this is nonsense! For a fixed "Total points", every point spent on DEX is one less point from "Other abilities". There should be aDEX -> "Other abilities"arrow in the diagram. ↩ -
StatQuest, R-squared. Mr Starmer does not propose using R-squared to analize the fit of arbitrary models, if the technique is not applicable the error is atributable to me. ↩