D&D.Sci, problem 3
This post is part of my "dnd.sci" series.
Problem statement
You have been assigned to undertake 10 consecutive trips over dangerous waters. You have a record of recent random encounters along your route, a list of interventions you may perform to improve your odds of success, and 100 gold pieces (which are, critically, not nearly enough to perform all interventions). Spend wisely, and good luck.
Data cleanup
There are 21795 trips on record, with four entries per record:
- "damage taken", which is "100%+" for sunken ships, and
\d+%(some digits, plus a percent sign) for ships that made it to port - "direction", which is either "southbound" or "northbound"
- "encounter", which is a string with the encounter type, or "unknown" for sunken ships
- "month of departure", which is of the form
m/YYYY, where m is betweeen 1 and 12 and YYYY is the year of departure
Damages being represented as strings will probably confuse automatic sorting routines, which would make plots annoying. "southbound" and "northbound" are pointlessly verbose. "unknown" for missing data… is less annoying that the standard missing value symbol, which is treated specially by most pandas algorithms. "month of departure" is actually a month and year, which need to be split apart.
Applying all of the above, and renaming the columns for brevity, we get the following:
- "dam", damage taken, represented as integers in the 1-100 range
- "dir", direction, represented as the single letter "n" or "s"
- "encounter", which I left alone
- "m", month of departure, integer in the 1-12 range
- "y", year of departure, integer in the 1396-1405 range
Analysis
Seasonality
We have to spend 10 months aboard the Grey Swan, from month 5, 1406 to month 3, 1407. This means that we will never travel on months 3 or 4 of the year. Are there any seasonal encounters we should be aware of?
df.pivot_table(columns="encounter", index="m", values="dam", aggfunc="count")\
    .plot(figsize=(10,5))
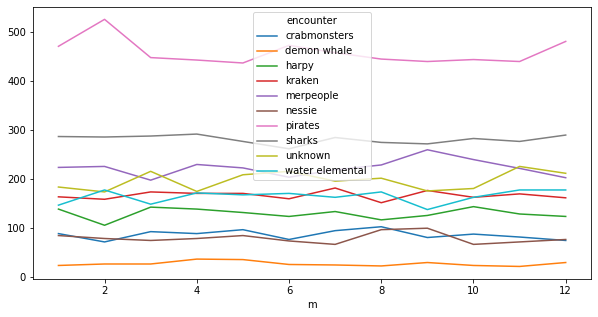
Not that I can spot at a glance.
Directionality
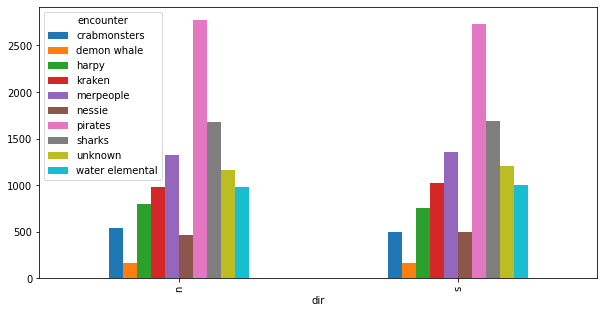
We have to make 5 northbound trips and 5 southbound trips, so this shouldn't matter, but I'm curious and it is easy to check:
df.pivot_table(columns="encounter", index="dir", values="dam", aggfunc="count")\
    .plot.bar(figsize=(10,5))
Long-term drift
We are looking at decade of data. It seems plausible that some trend has broken over such a long period.
enc_freq = df.pivot_table(
    columns="encounter", index=["y", "m"], values="dam", aggfunc="count")
enc_freq.plot(figsize=(10,5))
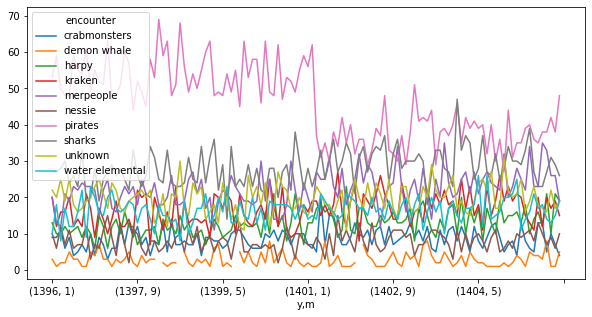
Pirate attacks went down somewhere between month 6, 1400 and month 6, 1401.
pirates_mean = enc_freq["pirates"].mean()
(enc_freq["pirates"].loc[(1400,6):(1401,6)] - pirates_mean).plot.bar()
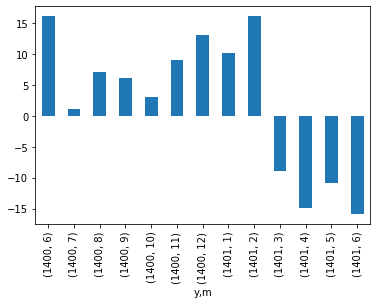
Looks like the drop happened between months 2 and 3, 1401. Since we know that every ship that travels these waters gets attacked by something, a drop in pirate attacks means an increase in other types of attacks.
# attacks per type, before and after the drop
freq_earlyvlate = enc_freq\
    .eval('late = y > 1401 or y == 1401 and m > 2')\
    .groupby("late")\
    .sum()

# attacks, as percent of total
freq_earlyvlate_per = freq_earlyvlate.apply(lambda r:
    r / freq_earlyvlate.sum(axis=1))

# percentile point variation
# +0.09 means an increase in share of 9 percentile points
freq_earlyvlate_perinc =
    (freq_earlyvlate_per.loc[True]
        - freq_earlyvlate_per.loc[False])\
    .sort_values(ascending=False)

freq_earlyvlate_perinc.plot.bar()
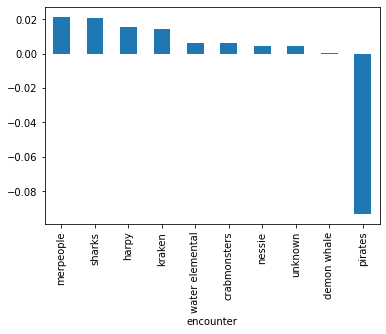
Merpeople, sharks, harpies, and kraken are the biggest winners. Pirates are the only ones whose share went down.
Encounter lethality
We can't see encounter lethality per-se (dead men tell no tales, so we don't know which encounters resulted in fatalities), but we can make some inferences given the damage distribution for each encounter type. In particular, encounters without long tails are likely 0% lethal, or easy to make 0% lethal.
df.hist(column="dam", by="encounter",
        sharex=True, sharey=False, bins=20, figsize=(13,5))
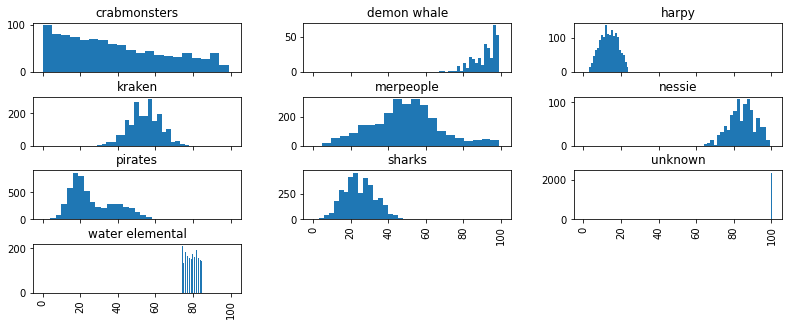
Interesting.
- Harpies, kraken, pirates, sharks, and water elementals stand out as likely survivable without intervention. Their damage outputs are tightly clustered, far away from the 100% mark.
- Crab monsters, demon whales and nessie are the obvious killers
- Pirates have a double hump that makes me think that either:
- there are two pirate populations out there
- the pirate population changed over the years
Looking at these histograms, I can make the following guesses for distribution shapes:
| encounter | distribution | generation |
|---|---|---|
| crabmonsters | geometric | roll to stop attack |
| demon whale | ? | ? |
| harpy | normal | roll n equal dice |
| kraken | normal | idem |
| merpeople | mix of normals | roll n equal dice, with some condition |
| nessie | normal | roll n equal dice |
| pirates | mix of normals | roll n equal dice, with some condition |
| sharks | normal | roll n equal dice |
| water elemental | uniform | roll 1 die |
It is possible, if implausible, that harpy damage has two humps rather than one, and we just can't see it because the second hump is composed entirely of sunken ships. We have no reason to reach into this weird bucket of possible worlds, because we have obvious suspects for the sunken ships.
Dangers of the pirate life
Damage from pirates has two humps, which suggests two populations. We also know that pirates became far less common between months 2 and 3, 1401. Hm.
enc_earlyvlate = df.eval('late = y > 1401 or y == 1401 and m > 2')
enc_earlyvlate.query('encounter == "pirates"').hist(column="dam", by="late",
        sharex=True, sharey=False, bins=20, figsize=(13,5))
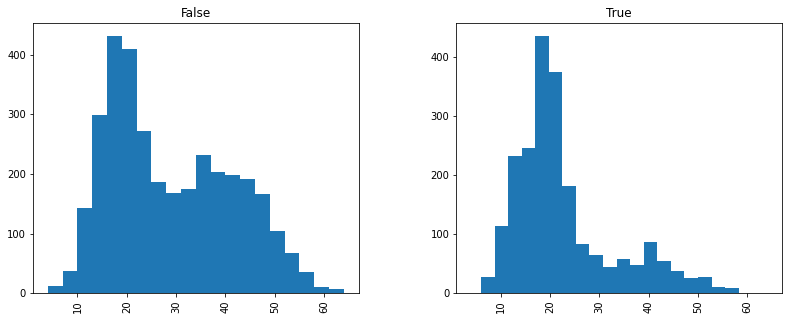
Indeed, pirates after march 1401 are not just rarer, they are much less destructive. I imagine the Navy finally had enough of pirates, and hit the nastier gang, hard.

Water elemental damage
I'm confident that water elementals don't sink ships, so modelling them doesn't provide much value. That said, they looked about uniform, so I suspect I can easily figure out the exact damage mechanism.
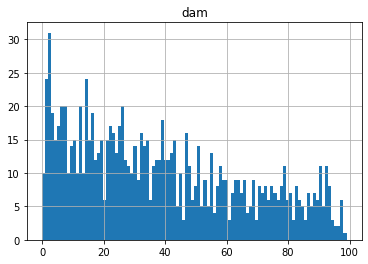
df.query('encounter == "water elemental"').hist(column="dam")

Damage done by water elementals doesn't look super uniform, but maybe?
df.query('encounter == "water elemental"')["dam"]\
    .value_counts().sort_index()
74    210
75    136
76    183
77    166
78    158
79    154
80    173
81    162
82    192
83    156
84    146
85    143
74 to 85 means twelve possibilities. 73+d12 damage? The way to go about checking whether this is true would be to model possible outcomes with a multinomial distribution, and doing a statistical test to calculate a degree of fit. But that is a lot of work for an entirely tangential point. What I did was to model each value as an independent "bucket".
There are 12 values damage can fall into. There are 1979 water elemental encounters (that we know of, but I think those are all of them). Around 1/12 encounters (165 in total) should roll a 1 on their damage roll, resulting in 74 damage. More precisely, the number of encounters that result in 74 damage, \(N_1\), follows a Binomial distribution: \(N_1 \sim \text{Binomial}(n=1979, p=1/12)\).
We can ask how likely it is that there will be no more than x encounters resulting in 74 damage by evaluating the cumulative distribution function, or cdf, of \(\text{Binomial}(n=1979, p=1/12)\). Conversely, we can fix our confidence at 95% and ask "up to how many encounters could there be, resulting in 74 damage, if I start with 1979 encounters?" by evaluating the inverse cumulative distribution function. The scypi module provides the percent point function for the Binomial distribution, which is the inverse cdf, but with a fancier name. q is the confidence level, expressed as a number in the (0, 1) range.
from scipy.stats import binom
print(
    binom.ppf(q=.05, n=1979, p=1/12),
    binom.ppf(q=.95, n=1979, p=1/12))
145.0 185.0
There is a 5% chance that the number of encounters resulting in 74 damage is no higher 145, and 95% chance that it is no higher than 185. That is: \(P(145 <= N_i <= 185) = 90\%\). Since the distribution of damages is uniform, the expectation for each possible damage value is the same.
This is all slightly wrong: if we are "unlucky", and there are lots of encounters that rolled 85 damage, that increases our chances of seeing surprisingly few encounters on the other damage brackets. Modelling with the multinomial distribution would have fixed that, but hopefully this is close enough.
There are 12 damage values, and each one has a 1/10 chance of having between 145 and 185 encounters in it, so we naively expect 1.2 of them to be out of range, and a bit more if we take into account that their results are linked together.
74    210    out
75    136    out
76    183    in
77    166    in
78    158    in
79    154    in
80    173    in
81    162    in
82    192    out
83    156    in
84    146    in
85    143    out
We got 4 out of the 12 falling out of range, which is… more than I expected. On the balance, this is likely still normal (not like I have a better hypothesis going for me), but I wouldn't bet money.
Crab monster damage
Crab monsters have this continuously-descending damage pattern that makes me think geometric distribution.
If I were generating this data, I'd roll a dice repeatedly to check if you shake off the crab monster or take 1 point of damage. If you have a 1/3 chance of shaking the crab off, the expected damage of the whole process is 3. If you have a 1/50 chance of shaking the crab off, the expected damage of the whole process is 50.
df.query('encounter == "crabmonsters"')["dam"].mean()
38.30355427473583
Mean damage is about 38, and we suspect some attacks, the ones with the highest damage, are not being reported. We can easily create a simulated dataset of 1000 encounters, with a 1/40 chance of shaking off the crab, and look at the resulting distribution.
from random import random
def sim(p):
    dam = 0
    while dam < 100 and random() > p:
        dam += 1
    return dam
pd.Series([sim(1/40) for i in range(0, 1000)]).hist(bins=100)
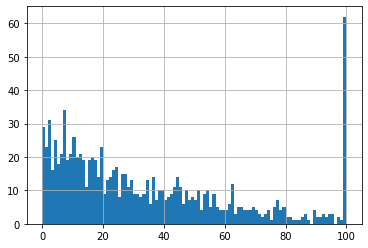
This seems plausible, if you mentally delete the huge spike at 100 and adjust the height of the bars, but the 1/40 value is suspect. Geometric distrubutions have long tails that make the precise value of p fairly hard to pin down.
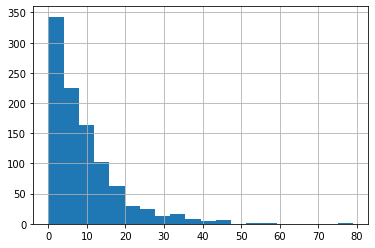
And about those long tails: the distribution of crab monster damage seems to very roughly follow a line, but geometric distributions are not lines, they are curves. The lower the chance of stopping at each step of the process, the harder it is to spot the curvature. Here's a simulation run with p=1/10, notice the obvious tail:
Conclusions
By far the most useful artifact my analysis produced is the plot of damage distribution per encounter. Let's see it again:
Here are the policy implications:
| Intervention | Encounter | Cost | Analysis |
|---|---|---|---|
| Shark repellent | Sharks | 40gp | Worse than useless. Shark encounters never sink ships, do relatively little damage, and protect the ship from other, nastier things. |
| Armed carpenters | Crabmonsters | 20gp | Excellent use of money. For 1/5 of our funds we can make crab monsters a non-issue. |
| Bribe merpeople | Merpeople | 45gp | Desirable, but expensive. Almost 1/2 of our funds, and merpeople aren't even the biggest threat. |
| More oars | Krakens, demon whales | 1gp/oar | Must-have. 40% damage reduction from the single biggest killer out there. This will literally save our life. |
| Cannons | Nessie, pirates | 10gp/cannon | Pirates (especially post-SWAT) are not much threat, but Nessie does plenty of damage and likely sinks some ships. |
| Rifles | Harpies | 35gp | Useless. Harpies never sink ships, and do very little damage. |
| Foam swords | Water elementals | 15gp | Excellent value for damage reduction, but does not increase our survival odds at all. Just under 1/6 of our funds, and pays off big when the encounter happens. |
From the above, we can formulate two plans:
Brave the mermen
The merpeople are too expensive to pay off. They may sink us, but the chance of facing them is low, and they damage way more ships than they sink. Instead we get armed carpenters, 20 more oars, 3 more cannons, and foam swords, for 85gp, leaving us with 15gp left over.
Bribe the mermen
If we are really intent on surviving no matter what, we can grease the scaly cogs of underwater bureaucracy and get ourselves a free pass from the merpeople. This does mean we are really strapped for cash. Foam swords need to go, and we still don't have enough. Running from the demon whales is the biggest impact intervention we can make. Arming the carpenters is probably second best. Nessie seems to do only just enough damage to sink ships; one cannon may be enough to drop his lethality to 0%.
We bribe the merpeple, and get armed carpenters, 20 more oars, and 1 more cannon, for 95gp, leaving us with 5pg left over.
Shameless self-promotion
I am currently on the look for a new job! If you have enjoyed my work and think I would be a good fit for your company, send me an email. I currently live in Argentina, but I'm searching for relocation options; out-of-country offers are more enticing than local offers. If you don't see an update immediately below, I'm still available.